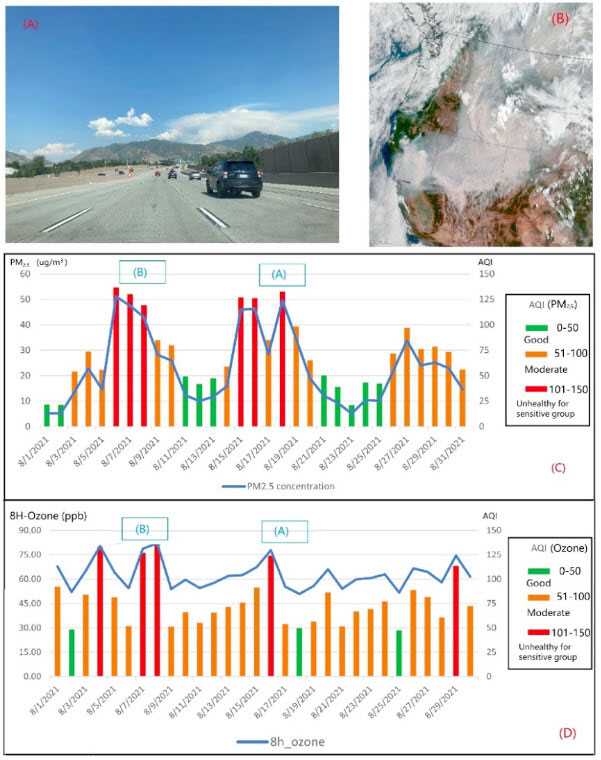
As one of the major emissions sources in the western U.S., smoke from wildfires is emitted to the atmosphere and transported downwind based on unique meteorological and topographical conditions. Due to the difficulties of direct measurement, it remains a challenge to quantify the air quality impacts from wildfire smoke. For example, a small human-caused wildfire occurred in Parleys Canyon, Utah on August 14, 2021. The smoke plume was released into the atmosphere (Figure 1(A), below), thousands of homes were evacuated and the air quality in Salt Lake City on the following days was significantly worse than usual (Figure 1(C) and (D)). Around the same time, California wildfires (Figure 1 (B)) emitted smoke with large amounts of pollutants, also contributing to unhealthy air quality in Salt Lake City (Figure 1(C) and (D)). Both fires caused increased ozone concentrations which indicates that secondary air pollutants are strongly affected by wildfire smoke. Though it is easy to tell that wildfire smoke has negative impacts on urban air quality from Figure 1, there is no tool to quantitatively measure wildfire impacts, nor to identify whether exceedance days are due to wildfire smoke or other emissions.
Transport of wildfire smoke plumes is a complex process, especially in intermountain areas. Differentiating the impacts of wildfire smoke from other emissions is also difficult because the current observations are not able to directly identify the source of pollutant species. Many plume rise models have been used to represent the distribution of smoke in vertical layers and are implemented into the chemical transport model (CTM) framework to estimate smoke emissions and transport. But the accuracy is limited by uncertainties in representing meteorological conditions, planetary boundary layer (PBL) conditions and fire intensity. Surface temperatures, wind speeds, atmospheric turbulence and other impact factors of complex mountain terrain make it challenging to accurately describe surface atmospheric dynamics during fire episodes. Surface meteorological conditions over mountains are not well estimated because the empirical formulas were developed for flat, uniform terrain. As a result, the surface turbulence that impacts PBL and plume injection heights are not accurately represented in mountain areas. New models are necessary to improve the simulation of plume rise and better estimate downwind smoke concentrations. The first scope (S1) of this work will develop a new plume rise model to estimate the plume injection heights for larger wildfires, which will improve simulations of smoke transport and downwind air pollution concentrations.
Air quality measured by many real-time monitoring networks. With monitoring data, several areas along the Wasatch Front are classified as nonattainment areas by the U.S. EPA. However, no technique can directly identify and quantify wildfire smoke impacts based on observations. Model simulations can be used to fill this gap. Many source apportionment techniques are available to investigate the relationship between high ozone pollution and wildfire activities during summer. But complex interactions between wildfire emissions and the urban environment result in uncertainties in model performance during the fire season. Major pollutants in wildfire smoke, NOx and VOCs, can significantly affect urban atmospheric chemistry as a result of the presence of wildfire smoke and interactions with urban emissions. Such changes include the switch of the dominant ozone precursor regime. Heat energy from smoke also changes urban climatology which can modify the photochemistry. Complex atmospheric urban physical and chemical dynamics make model simulation difficult to accurately describe wildfire smoke impacts on ambient air quality, therefore, further research is necessary to improve CTM simulations. The second scope (S2) of this work is to use CTM ensemble simulations to determine wildfire smoke contributions to local air quality using source apportionment techniques.
Pollutants from wildfire smoke, such as particulate matter (PM), nitrogen dioxides (NO2), volatile and semi-volatile organic compounds (VOCs/SVOCs), lead to primary and secondary pollutants during transport, resulting in significant negative impacts on local and downwind air quality once they are released to the atmosphere. It has been shown that urban air quality decreased significantly due to the transport of aerosols from wildfires, leading to millions of dollars of economic loss. A fast-response, real-time tool is needed to provide not only current air quality levels but also identify the air quality impacts from wildfire smoke. Such a tool will help estimate the wildfire-related smoke exposure risk on human health and can be used for public health alerts during fire seasons. Additionally, this tool can be used in retrospective air quality analysis to assist in identifying which National Ambient Air Quality Standards (NAAQS) exceedance days have contributions from wildfire smoke. The last scope of this work (S3) is to develop a fast-response tool to identify NAAQS exceedance days with large contributions from wildfire smoke.
- Principal Investigator: Heather Holmes (University of Utah)
- Study period: July 1, 2022 – June 30, 2023
- Funded by Science for Solutions Research Grant: $61,738
- DAQ Contact: Chris Pennell ([email protected])