Particulate matter (PM) is a complex mixture of small, solid particles and liquid droplets in the air. PM10 is particulate matter that is 10 microns (μm) or less in diameter. It is a mixture of materials that can include soot, metals, salt, and dust. Major sources include:
- Vehicles
- Wood-burning
- Wildfires or open burns
- Industry
- Dust from construction sites, landfills, gravels pits, agriculture, and open lands
Air Quality Standards
The health-based, National Ambient Air Quality Standards (NAAQS) for PM pollution specify the maximum amount of PM present in outdoor air. The Environmental Protection Agency (EPA) developed different health-based NAAQS for PM10 and PM2.5, in part because the coarser PM10 can be filtered out in the nose and throat, while PM2.5 is able to bypass this filtration system and penetrate deeply into the lungs, resulting in more serious health effects. PM concentration is measured in micrograms per cubic meter, or µg/m3.
In 1987, the EPA set new air-quality standards for PM10 of 150µg/m3 over a 24-hour period and an average of 50 µg/m3 annually. EPA revoked the annual PM10 standard in 2006 because the agency couldn’t show any adverse impact to human health.
Area Designations
Nonattainment designation is determined by the EPA when an area or areas within a state persistently exceed the National Ambient Air Quality Standards. Attainment designations are determined when an area or areas within the state is in compliance with the National Ambient Air Quality Standards.
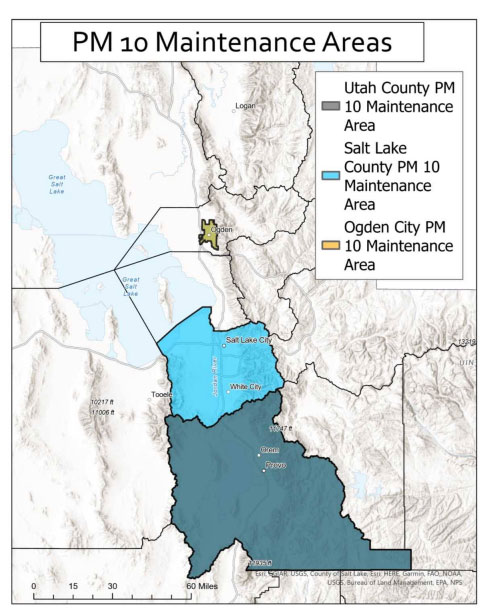
Ogden City, and Salt Lake and Utah Counties were officially designated as attainment for PM10 NAAQS effective March 27th, 2020. These three former nonattainment areas are now subject to the maintenance plans that were approved by EPA and the areas must continue to attain the standard for the first maintenance period of ten years.
Utah PM10 Maintenance Areas:
Including nonattainment area boundaries and the townships and ranges of the legal descriptions.
Air Trend Plots: PM10
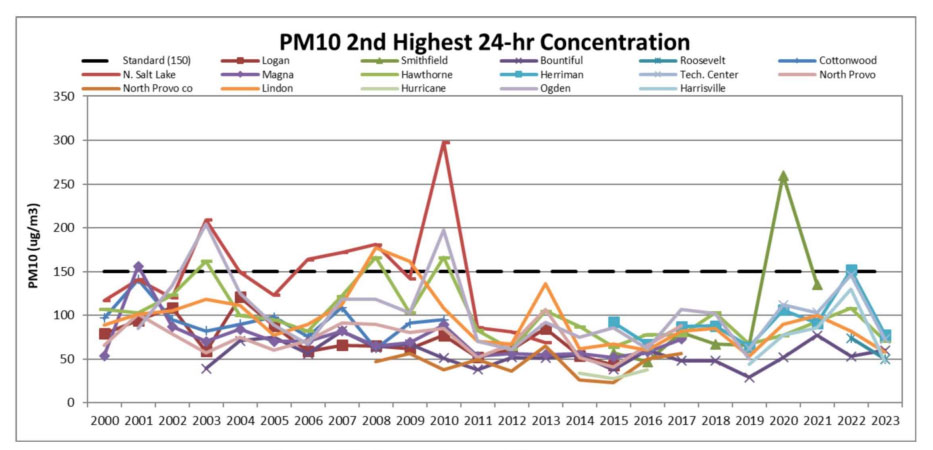
For PM10, most high values tend to occur during wintertime inversions. In the summertime, high wind events can also lead to unusually high PM10 values. Trends are somewhat difficult to evaluate because weather plays such a large role in the data collected from year-to-year. This is why the standard is evaluated over a three-year period.
The fluctuations in this chart reflect the variability produced by meteorology and high-wind events.
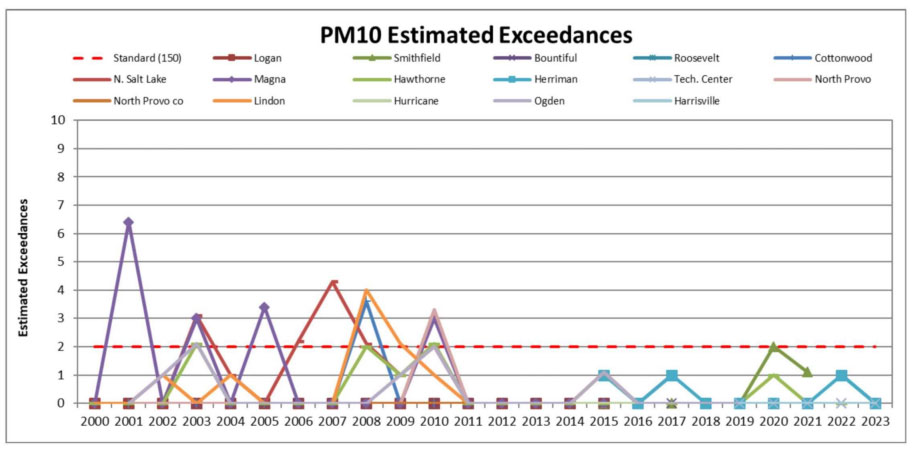
Chart of PM10 Estimated Exceedances and 2nd highest 24-hr concentrations recorded from 2000-2023
High values of monitored PM10 sometimes result from exceptional events, such as dust storms and wildfires. The data from such events can be flagged under the EPA Exceptional Events Rule for exclusion by EPA when they cause a violation. While there have been isolated high values in the past 14 years, none resulted in a violation of the NAAQS. The figure below shows the PM10 estimated exceedances at monitored sites in Utah since 2000.
The statistical form of the standard essentially allows for one exceedance per year, regardless of how high the value may be. For this reason, it is often useful to look at the second highest value collected at a particular location. The figure below shows the second ighest 24-hour PM10 concentrations recorded at each station since 2000. The heavy dashed line indicates the NAAQS.