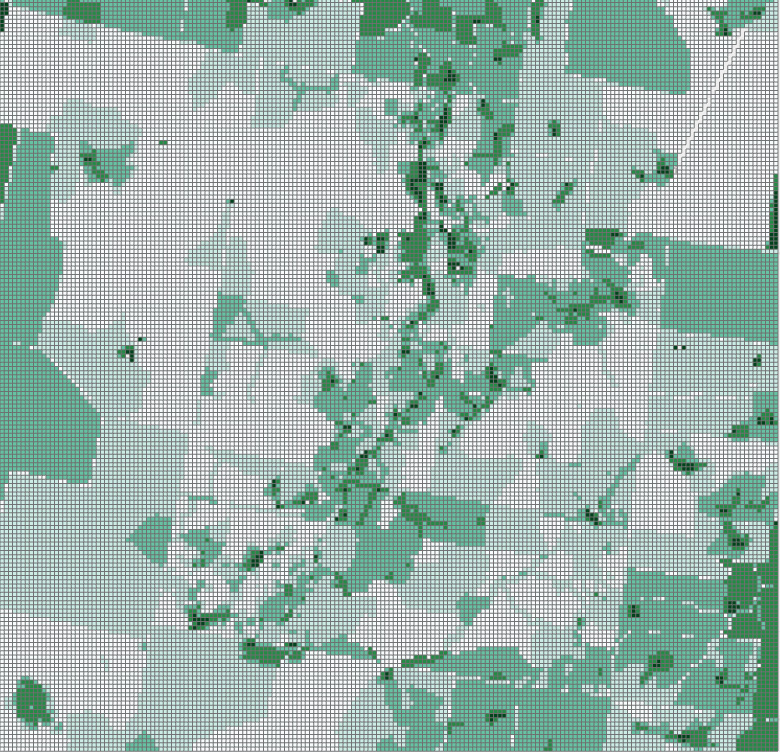
Utah Division of Air Quality has used Geographic Information Systems (GIS) for air quality modeling studies since 1993 by creating its own database of relevant spatial layers. This data helps in the creation of emission inventories for ozone and fine particulate modeling. This is done through the creation of demographic surrogates so that county-wide emissions can be further refined and placed in the urban, densely populated areas of the county. A similar technique is used to process the emissions for automobiles that are obtained from the Metropolitan Planning Organizations.
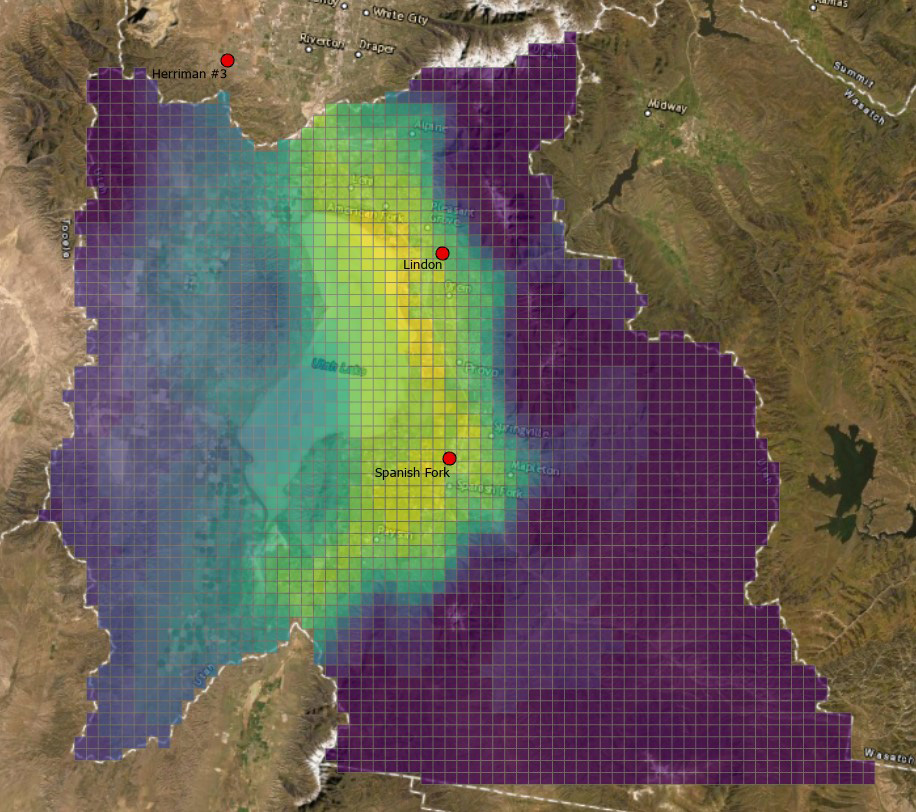
Two other important uses of a GIS in modeling are for quality assurance and the analysis of modeling results. In both cases data that is in a tabular form, consisting of numbers in rows and columns, can be transformed into a visual display in which patterns are more readily discerned. A check of the spatial distribution of emissions can readily detect location problems. Likewise, a visual depiction of pollution concentrations estimated by the air quality model can be easily understood by both technical analysts and members of the public who may be unfamiliar with many of the technical aspects of the modeling.
Examples