PM2.5 air trend plots show PM2.5 pollution level tracking over time in graph format. PM2.5 data has been collected at most monitoring stations since 2000. Like PM10, maximum values also tend to occur during wintertime inversions. Also like PM10, trends are somewhat difficult to evaluate because weather plays such a large role in the data collected from year-to-year. This is why the standard is evaluated over a three year period.
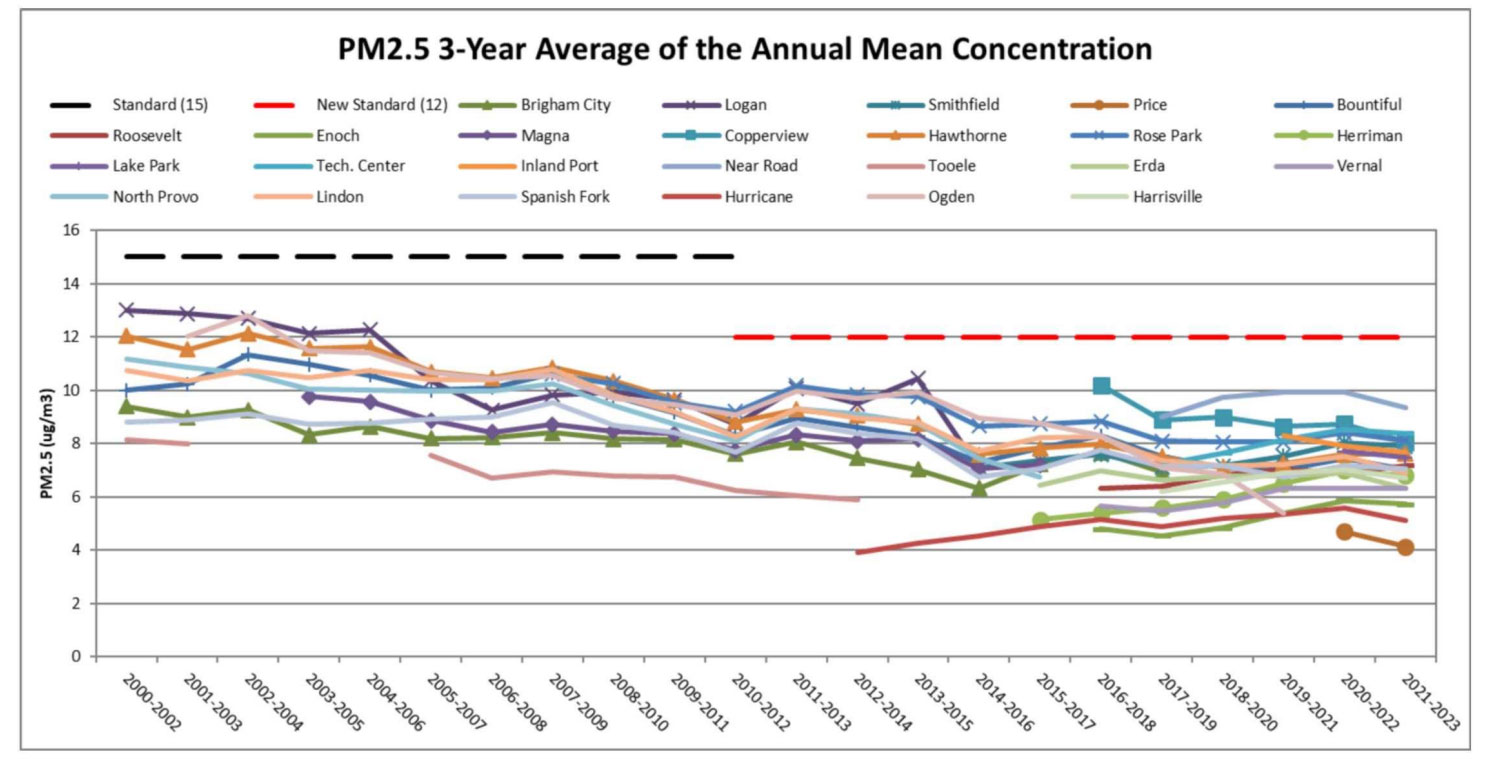
Three-year Average Annual Mean Concentrations
Shows how compliance with the annual NAAQS is evaluated
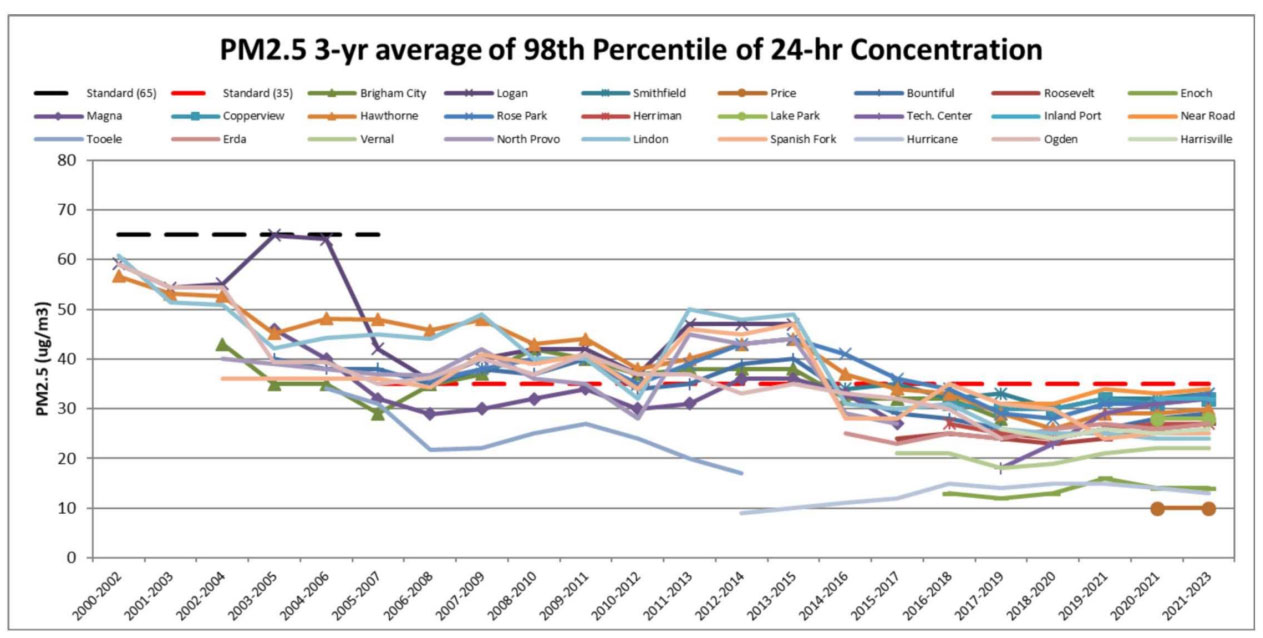
Three-year Average of the 98th Percentile 24-hour Concentration Recorded for Each Year
Shows how compliance with the 24-hour NAAQS is evaluated