By Kimberly Kreykes
Like many people, my day starts with the weather forecast. Not just because it is my passion, but because it is my responsibility to stay informed — I am the lead air-quality forecaster for the Utah Department of Environmental Quality’s (DEQ’s) Division of Air Quality (DAQ). Along with two other DAQ forecasters, Shauna Ward and Kristy Weber, our team forecasts the air-pollution and action conditions for the state of Utah twice a day, 365 days a year.
For the morning forecast, all available members of the team individually review the atmospheric conditions and come to their own conclusions. Then, at 8 a.m. we meet and decide collectively on the forecast for the day. In the evening, the forecast is the responsibility of a particular team member who updates the forecast every evening for a week.
Summer Forecasts
I’m often asked what I look at and am looking for when I make the summer air-quality forecast. During the summer months, air-quality forecasters have two main concerns: summer ozone production and summer particulate-matter events.
Summer ozone is a health concern for many people. Ozone is created by chemical reactions between oxides of nitrogen (NOx) and volatile organic compounds (VOCs) — emissions from industrial facilities, area sources, and motor-vehicle exhaust. During the summer, these chemicals react in the presence of heat and sunlight to create ozone.
The second concern is summer particulate matter (PM) events. These events include, but are not limited, to wildfire smoke, wind-blown dust, and fireworks. What this means is while many of the same atmospheric-forecasting products are used for both ozone and PM, there are a few specialized products that focus on PM forecasting.
Every day, the forecasters at DAQ search for new information sources and models to help improve the accuracy of the air-pollution forecast. While we use many sources to help us understand what’s going on in our atmosphere, the following five sources are the main ones we use to make the forecast call.
Monitor Measurements
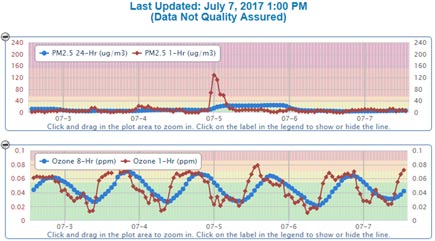
I need to know what the monitoring equipment across the state is measuring. What are the local trends, and am I seeing a pattern? In this chart for PM2.5, the PM released from fireworks was captured at the Lindon monitor. This graph also shows the 1-hour and 8-hour average ozone values from the Lindon monitor during the same time period. When I combine the information from across the state I can infer how the previous day’s meteorological events affected the air-pollution measurements.
Meteorological Measurements
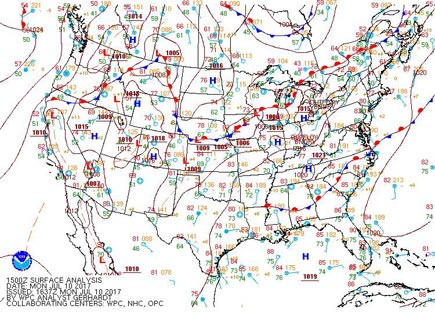
Normally, this is a quick check to make sure previous forecasts have verified. Where are the Highs and Lows located? What are the winds speeds? Where are the cold and warm fronts located? What are the temperature and dew point in the surrounding areas? This is all important information we need to know to make the most accurate air-pollution forecast.
Satellite Images
We use visible, water vapor, and infrared satellite images to expand on information measured at the surface. These images help us know what the moisture content of the air is, what the cloud thickness is, what the cloud heights are, where the fronts are located, and sometimes if smoke and dust are visible.
Hazard Mapping System Fire and Smoke Products and InciWeb
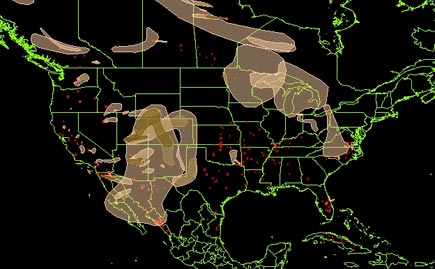
The Hazard Mapping System (HMS) Fire and Smoke product shows hot spots and smoke plumes that indicate possible fire locations. Significant smoke plumes detected by satellites are outlined, along with an estimate of the smoke concentration. The HMS is useful in finding potential, large fire locations, but confirmation of actual burning in necessary when wildfire smoke is suspected. Most states have a fire info webpage with information about large wildfires and prescribed burns. InciWeb, an interagency all-risk incident information-management system, contains information from across the United States, which helps us determine whether wildfire smoke is originating from outside the state.
For example, on June 25, 2017, the question on everyone’s minds was, “Is that smoke?” followed quickly by, “Is the smoke from the Brian Head fire?” Through analysis of the HMS and surface wind charts it was determined that, “Yes, it is smoke,” and “No, the smoke originated from several fires in Nevada.”
Meteorological Models
Once I have a strong understanding about the current state of the atmosphere, I want to look at the meteorological models. These are numerical models that predict the future meteorological conditions for their forecasting domain. I use the models to determine where clouds may form in the afternoon, how a cold front may move through the surrounding area, or where the afternoon wind speed and direction will push the ozone produced during the afternoon.
Meteorological models are not perfect, and with ozone levels, the most important factor for determining the difference between a “moderate” and an “unhealthy for sensitive people” forecast could be cloud development at 4 p.m. instead of 5 p.m. The limitation of wind and cloud modeling makes this aspect of the forecast less of a bright line and more of a fuzzy interpretation with a best guess.
Air-quality forecasting is both an art and a science. Although we have a wide range of scientific resources at our disposal, weather conditions can change quickly, and those changes can impact air-quality positively or negatively. We realize that many of you depend on our forecasts to plan your day and protect your health, so we do everything we can to ensure that you always have the most accurate, up-to-date information available.
One of most common questions I get from the public is, “Where can I find the air-pollution forecast?” The best place to find our forecast is on the DAQ website, or on the UtahAir app (Android or iOS). We also provide the forecast in a phone message (800) 228-5434, but since the phone message can only be one and a half minutes long for all the action conditions for the state, the message ends up going by really fast during complex air-pollution days. I recommend using the website or the app to get the most recent and accurate air-quality information.

I am an Environmental Scientist with the Utah Department of Environmental Quality’s Division of Air Quality. I graduated with a Masters of Atmospheric Sciences from the University of Michigan. In my spare time, I knit, read books, and play video games.