The Utah Lake Water Quality Study Water Quality Assessment and Analysis (Phase 1) had two primary objectives:
- Re-evaluate, confirm, clarify, or expand on the beneficial use assessment for Utah Lake conducted under DWQ’s 2016 Integrated Report.
- Provide a baseline analysis of relevant water-quality parameters including analyses of temporal and spatial trends and relationships among water-quality parameters in support of the broader Utah Lake study process.
DWQ performed a baseline analysis of several relevant water-quality parameters, trophic state indices (TSI), and lake-elevation data. The process included analyses of spatial and temporal patterns in water quality, relationships among water-quality parameters and TSIs, and relationships between water-quality parameters and lake elevation. These analyses were intended to provide a baseline characterization of water-quality trends and patterns to be used to inform future decisions regarding scientific studies, hypotheses to be tested, and potential management strategies for Utah Lake.
This assessment is limited to parameters for which water-quality standards or beneficial use assessment methods are currently available. However, temporal and spatial patterns in these and other parameters can be visualized through the Utah Lake Data Explorer (ULDE).
Water Impairments
Waters reported as impaired don’t meet their designated beneficial uses and are sometimes referred to as “303(d)” waters, the section of the Clean Water Act that requires states to identify non-supporting waters. Utah Lake was listed on the 303(d) list in 2002 for exceedances of the state’s water-quality criteria for total phosphorus and total dissolved solids.
An aquatic life use (ALU) impairment was added in 2010 based on PCB levels in fish tissues. The Provo Bay portion of Utah Lake was split from the main body of the lake for assessment purposes and listed for aquatic-life impairments of pH and total ammonia. Listings for PCB in fish tissue and total phosphorus were carried over to Provo Bay, and Provo Bay was delisted for TDS.
In its 2016 Integrated Report, DWQ also identified Utah Lake as non-supporting for recreational use due to high levels of blue-green algae (cyanobacteria) that occur in the lake and lead to harmful algal blooms.
Deliverables
- Determine whether current impairments to designated beneficial uses occur, and whether the lake should remain listed on the 303(d) list.
- Determine whether Utah Lake should be split into more than one assessment unit for purposes of standards development, total maximum daily loads (TMDLs), and impairment determinations.
- Inform the public health advisory process for Harmful Algal Blooms (HAB) to provide faster sampling response and communications to the public when HABs reoccur.
Accomplishments
Beneficial Uses
The state classifies waters based on their beneficial uses and develops water-quality standards to protect those uses. Utah has five beneficial use categories: drinking water, recreation, aquatic wildlife, agriculture, and the Great Salt Lake. Utah Lake is protected for the following designated beneficial uses:
- 2A: Frequent primary contact recreation where there is a high likelihood of ingestion of water or a high degree of bodily contact with the water
- 2B: Infrequent primary contact recreation such as boating, wading, or similar uses
- 3B: Warm-water species of game fish, including the necessary aquatic organisms in their food chain
- 3D: Other aquatic wildlife.
- 4: Agricultural uses including irrigation of crops and stock watering
Utah Lake water is also utilized extensively for secondary irrigation, both from within the watershed and its outflow into the Jordan River.
Recreational Use
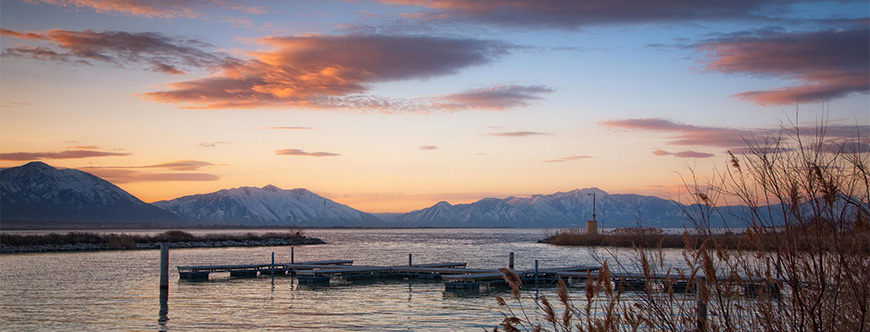
Primary contact recreation activities include wading by children, swimming, water skiing, kayaking, and other activities involving a significant risk of ingestion of water. A primary contact recreation classification protects people from illness from activities that have the potential for ingestion of, or immersion in, water. Boating, swimming, and water skiing are historic and common recreational uses in Utah Lake.
E. coli.
A total of 12 E. coli. sampling events (page 41) were conducted in Utah Lake during the 2016 Integrated Report (IR) cycle (2008-2014). These samples identified Utah Lake as fully supporting the 2B recreational use for E. coli. However, since the 2016 IR assessment was completed, an E. coli. advisory was issued at Lindon Marina and additional monitoring identified exceedances of E. coli. standards in Lindon Marina and at Lindon Beach north of the marina. Samples collected at Lindon Beach identified E. coli. impairments under both 2A and 2B criteria. Samples collected in Lindon Marina would result in impairments under 2A, but not 2B, criteria.
Harmful Algal Blooms
Harmful algal blooms (HABs) (page 41) were sampled during the summers of 2014 and 2016. Satellite imagery and observed high algal growth in Utah Lake suggest that similar occurrences have likely happened in other years as well. A synopsis of the 2014 HAB event is available in Chapter Five of DWQ’s 2016 Integrated Report.
DWQ was able to expand its HABs data during the summer of 2016. A potential HAB was first reported to DWQ on July 12, 2016, and the first HAB samples were collected on July 13, 2016. Initial samples at all sites identified very high cyanobacteria cell densities, including several samples exceeding 15 million cells per milliliter (cells/mL). Cell densities gradually decreased at all locations through the end of September.
Samples collected early in the bloom were generally dominated by cyanobacteria of the genus Aphanizomenon. However, assemblage composition varied through time and was also site-dependent. Assemblages in the open waters of Utah Lake and in the Jordan River at the outlet of the lake progressed from Aphanizomenon dominance to a mixture of Microcystis, Dolichospermum, and Aphanizomenon. Samples collected at beaches and marinas throughout the lake showed much greater variability in composition with assemblages including mixtures of Aphanizomenon, Dolichospermum, Geitlerinema, Microcystis, Oscillatoria, Phormidium, and Pseudanabaena. Of 108 samples collected for cyanobacteria cell counts, a total of 34 exceeded DWQ’s current recreational-use impairment threshold for HABs. These exceedances were observed in 18 unique locations over the course of about six weeks (July 13 – Aug 31, 2016.)
During the HAB events of 2016, DWQ and partners also collected 33 samples for cyanotoxin analysis by enzyme-linked immunosorbent assay (ELISA). Targeted cyanotoxins included β-Methylamino-L-alanine (BMAA), anatoxin-a, cylindrospermopsin, microcystin, and saxitoxin. Microcystins were detected in eight of 33 samples.
Although measured toxin concentrations through the 2016 HAB events were generally low, over 150 recreationists exposed to the bloom reported adverse health effects consistent with cyanobacteria exposure, including vomiting, diarrhea, nausea, headache, and skin and eye irritation, to the Utah Poison Control Center (UPCC). It is unclear whether these health effects resulted from irritation caused by cyanobacterial cells, unknown cyanotoxins, known cyanotoxins that went undetected, or other causes. However, these effects are consistent with those documented in epidemiological literature. DWQ is currently working with UPCC to better characterize these reports and examine their potential linkages to HAB exposure.
Aquatic Life Use
Aquatic species are any plant or animal that lives at least part of its life cycle in water. Pollutants or conditions that can affect aquatic life are water temperature, dissolved oxygen levels, and concentrations of toxic substances such as ammonia, metals and pesticides.
Water-Column Profiles
DWQ plotted water-column profiles in Utah Lake to identify potential exceedances of 3B Aquatic Life Use standards (page 34) for pH, dissolved oxygen (DO), and water temperature. Because Utah Lake is typically mixed and not stratified, pH, DO, or temperature exceedances in 10 percent of the water column, including at least two points on the profile, is considered impaired.
Although temperature and pH occasionally exceeded the 3B Aquatic Life Use criteria within the water column, profiles did not identify temperature or pH impairments in portions of Utah Lake other than Provo Bay. At the Provo Bay monitoring location, eight profiles of the 23 collected identified pH impairments.
DWQ examined DO profiles against both the 3B Aquatic Life Use early-life-stages (ELS)-absent and ELS-present minimum DO criteria. Profiles did not identify impairments of the ELS-absent DO criterion. Potential impairments of the ELS-present criterion were occasionally observed throughout the lake. However, it is currently unclear where and when ELS are likely to be spatially and seasonally within the lake. In addition, it is important to note that DO assessments made from profiles collected under daytime conditions when algae are photosynthesizing and producing oxygen are likely to miss low DO values and may be insufficient for determining full beneficial use support. DWQ is currently working to enhance high-frequency data collection in Utah Lake as well as throughout the state to help fill this data gap.
High-Frequency Data
DWQ analyzed high-frequency DO, temperature, and pH data collected from the Utah Lake buoy network from August 26 – November 15, 2016. Although these parameters were collected at a high frequency, use of these data as an assessment tool may be limited by their fixed location and depth of collection as compared to the collection of water-quality profiles. DWQ compared DO, pH, and water temperature data to applicable standards for Utah Lake. In addition to comparing to minimum DO values, collection of high frequency data allows comparisons to seven-day average standards for ELS-present and ELS-absent and to the 30-day average standard.
The ELS-present DO minimum standard was violated on two days at the Provo Marina site. No exceedances of the ELS-absent DO minimum standard were identified. Similarly, no violations of the 7- or 30-day average standards were identified. No exceedances of pH or water-temperature standards were identified from these data.
Ammonia
Total ammonia concentrations are generally low in the main body of Utah Lake. However, elevated concentrations occur in Provo Bay. Aquatic Life Use ammonia criteria are pH and temperature dependent. For all ammonia measurements with appropriately matching pH and temperature data, acute, chronic ELS-absent, and chronic ELS-present criteria were calculated and compared to observed ammonia concentrations. Acute ammonia exceedances were not observed in the main body of Utah Lake. Seven acute ammonia exceedances were identified in Provo Bay, all of which occurred under high pH conditions. Only one other site, Goshen Bay, experienced occasional exceedances of the chronic ELS present criteria.
Metals
Impairments for dissolved metal water-quality standard exceedances have not been identified in Utah Lake. A total of 12 dissolved metal samples taken in Utah Lake were assessed for the 2016 IR against dissolved metal aquatic-life use standards (pH and hardness corrected as appropriate). No exceedances of dissolved metal standards were identified. DWQ will continue to monitor and assess dissolved metal concentrations in Utah Lake in conjunction with the routine assessment process.
Agricultural Use
Total Dissolved Solids
Total dissolved solids (TDS) concentrations (page 39) varied significantly in time and space in Utah Lake. Exceedances of the 4A agricultural use criterion for TDS typically occur during low-water years. Exceedances occurred at all sites except Provo Bay.
Harmful Algal Blooms
Harmful algal blooms (HABs) (page 39) may negatively impact agricultural uses by exposing humans, crops, and livestock to cyanobacteria and cyanotoxins through the irrigation of crops and stock watering. DWQ is currently working with partner agencies and stakeholders to incorporate appropriate sampling procedures and methods for characterizing and assessing HAB impacts on agricultural uses. A formal assessment of these impacts was not fully conducted here. However, during the Utah Lake HAB events of 2016, irrigation water was shut off or closed to use to avoid potential contamination of crops or exposure of humans and livestock to cyanobacteria or cyanotoxins. This loss of water use suggests HABs in Utah Lake may have negative impacts on agricultural uses downstream. See the recreational use assessment section below for additional information regarding observed HABs in Utah Lake.
Secondary Water Uses
Utah Lake is a major source of secondary irrigation water (page 40) throughout the Jordan River Valley. Secondary water uses may be impacted by TDS and HABs similarly to traditional agricultural uses. However, the uses of secondary waters may differ from traditional agricultural uses and therefore may be differentially impacted by water-quality issues. In particular, secondary water usage can occur in more urban environments where human exposure may be greater. DWQ is currently working to quantify secondary water use from Utah Lake and determine whether general agricultural-use protections are also protective of secondary uses.
Trophic State Analysis
“Trophic state” is often used to describe the overall productivity of a lake. Ideally, this would be measured as the total biomass contained in a lake. However, given the impracticality of measuring total biomass, indicators such as chlorophyll a concentration, total phosphorus concentration, or water clarity as measured by Secchi-disk depth are used to estimate trophic status.
Trophic State Indices
One method for estimating trophic state (page 44) from these indicators is through the use of trophic state indices (TSI). A TSI is an estimate of total algal biomass based on one or more trophic indicators. Calculating TSI values effectively converts each of these measures with different units to comparable TSI units. Once calculated, these independent TSI indicators can be used to interpret how various factors interact to influence lake productivity. DWQ calculated TSI values (page 45) for surface samples of total phosphorus (TP), chlorophyll a, and Secchi disk depth, then analyzed for spatial and temporal trends and compared between different TSI indicators.
When DWQ examined relationships among and differences between the three TSI values through temporal trend analyses, Secchi TSI was consistently higher than both chlorophyll a and TP TSIs regardless of season. TP TSI was statistically higher than chlorophyll a TSI; however, the difference was relatively small and there was substantial overlap among the values. When the data were subset to the peak growth season (August-October), the chlorophyll a and TP TSI values were statistically equivalent.
National context for Utah Lake’s trophic status
DWQ compared the patterns (page 50) identified in Utah Lake to those in the National Lakes Assessment (NLA) dataset. The NLA uses a probabilistic sampling design that provides a statistically representative sampling of the nation’s lakes. This dataset provides an excellent comparison point for relationships among trophic indicators in Utah Lake and identification of any potential deviations from expected relationships based on a wide range of lake conditions.
chlorophyll a and total phosphorus-based TSI values in the main body of Utah Lake are typically within the 50th to 75th percentile of observed values nationally. Secchi disk TSI values in the main body of Utah Lake are consistently above the 75th percentile of national lakes. TSI values from the Provo Bay portion of Utah Lake are consistently above the 75th percentile of national lakes for all three TSI types.
The relationship between chlorophyll a and TP in Utah Lake is generally consistent with the relationship present in the NLA dataset, and chlorophyll a concentrations in Utah Lake are within the range expected based on TP concentrations. Algal growth in Utah Lake is not suppressed relative to TP concentrations as would be expected if algal growth is limited by light, implying that algal growth in Utah Lake is either phosphorus-limited or co-limited by phosphorus and nitrogen. In the NLA dataset, total nitrogen (TN) and chlorophyll a concentrations are also positively related. However, TN data in Utah Lake is sparse, limiting the ability to quantify the relationship between chlorophyll a and nitrogen or compare this relationship to the NLA data. Recent collections of TN concentrations in Utah Lake should increase the ability to characterize this relationship in the future.
Secchi disk depth in Utah Lake is lower compared to the average of other lakes in the NLA dataset with similar ranges of chlorophyll a and TP concentrations. This implies that a greater proportion of turbidity in Utah Lake is comprised of non-algal particulates than commonly observed in other lakes. However, the prevalence of non-algal particulates does not seem to have overwhelmed the relationship between chlorophyll a and TP or caused lower than expected algal growth relative to other lakes within a similar range of TP concentrations.
Monitoring Methods for the Water-Quality Assessment
Water-column profile data for temperature, dissolved oxygen, and pH are typically collected at the surface and at every meter of the water-column depth. As part of the profile collection, Secchi depth is also measured. Surface-water chemistry samples are collected from a depth of 0.5 meter. All water-chemistry samples, except dissolved metals and algae, are collected at the surface. Dissolved-metals samples are collected one meter above the bottom. Algal samples, which are analyzed for taxonomic composition and primary production (chlorophyll a), are collected as a composite sample from two times the depth of the Secchi-disc reading to the surface, up to a maximum of two meters.
This beneficial use assessment is primarily focused on data available up to the year 2016. However, assessments will continue to be updated as additional data become available.
DWQ Routine Monitoring
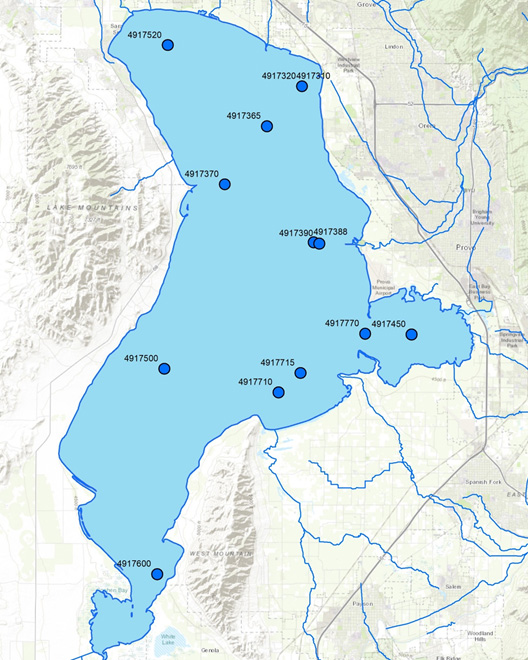
Since 1989, DWQ has regularly monitored Utah Lake at eight locations. Samples collected at these locations have included water-column profiles, water chemistry, and algae samples. However, the location, frequency, and measured parameters of sampling have varied through time. Data available from other sites were included in the assessment.
Harmful Algal Bloom Monitoring
DWQ has actively monitored for harmful algal blooms (HABs) in Utah Lake since 2014. Monitoring (page 33) was traditionally conducted in response to observed HAB events to assess potential human exposure to cyanobacteria or cyanotoxins. HAB data were collected during the summers of 2014 and 2016 in response to observed blooms on Utah Lake. Results from the 2014 sampling are presented in Chapter Five of DWQ’s 2016 Integrated Report.
During the summer of 2016, DWQ and partner agencies collected 107 samples for cyanobacteria cell counts and 33 samples for cyanotoxin analyses from throughout the lake. Over the past two years, DWQ and its research partners have conducted weekly monitoring on the lake, targeting recreational access areas and observed algal scums.
High-Frequency Data Network
DWQ installed a network of three monitoring buoys in Utah Lake in the summer of 2016. These monitoring buoys collect a variety of relevant parameters including pH, turbidity, chlorophyll a, dissolved oxygen, and phycocyanin at 15-minute intervals. Although the buoys (page 33) were operational for a relatively short time period in 2016 (August 26 – November 15, 2016), analyses of the available data are part of the assessment. DWQ will continue to deploy the buoy network annually from April through November at three sites: two miles west of Vineyard (Vineyard), one mile west of Provo Marina (Provo Marina), and one mile west of Bird Island (Bird Island).
External Data
External datasets are also often considered in DWQ’s beneficial use assessments. External datasets for Utah Lake are still undergoing review and considered provisional. Provisional data are not used in assessments, but may be used to update assessments as appropriate in the future.